


There is a strange irony sitting at the heart of the energy transition right now. Wind and solar are growing faster than almost anyone predicted a decade ago. Renewables covered 45.5% of the EU’s total electricity in Q1 2026, according to Eurostat, with wind leading the renewable mix at 44.9%, followed by hydropower at 28% and solar at 17.3%. And yet, on the sunniest, windiest days, some of that clean power is being deliberately switched off or turned down. Not because something broke. Not because the grid failed. Because, for that hour, there is simply more electricity being generated than there is demand for it, and supply outpacing demand this way is exactly what pushes prices down and makes running the turbine no longer worth it (source).
In short: wind and solar farms are increasingly being curtailed because wholesale electricity prices are set hour by hour based on supply and demand, and when renewable output floods the market on a good weather day, prices can fall to zero or below. This is becoming more common as renewable capacity grows faster than the grid’s ability to store or shift that power, and it changes how a project’s profitability should actually be assessed.
This piece covers why that happens, how hourly electricity prices actually get set, and where storage fits in. Then I’ll share my own take, on why the usual way we assess a wind site’s potential is starting to miss half the story.
The Mismatch Nobody Designed For
Here’s the underlying tension. Wind and solar generate electricity based on weather, not on when people actually want to use it. A wind farm doesn’t know it’s a Tuesday afternoon with low demand. It just generates when the wind blows. As more of these weather-dependent sources get added to the grid, without a matching increase in the ability to store or shift electricity use, there are more and more hours where supply simply outstrips demand.
When that happens, wholesale electricity prices can fall to zero, or even go negative, meaning generators effectively have to pay to keep exporting power. This isn’t confined to any one country or region, and the picture is genuinely global. In 2025, the share of hours with negative prices rose to around 6% in France, Germany, the Netherlands, and Spain, up from roughly 3 to 5% in 2024, with Spain seeing the sharpest jump (hours roughly doubling) and France close behind (up 45%). At the same time, Finland and Sweden, previously among the worst affected, saw negative-price hours fall by around 40% and 30% respectively, while California and Texas also saw declines. Meanwhile South Australia and Victoria in Australia saw negative pricing rise further, driven largely by increased overnight wind generation (source).
It’s a structural feature of adding renewable capacity faster than a grid’s flexibility can keep pace, and where storage and flexibility have scaled up quickly, the trend can and does reverse.
So How Does the Price for That Hour Actually Get Set?
This part rarely gets explained clearly, and it matters a lot for understanding why curtailment happens at all.
In most electricity markets, the price for each hour is set through a day-ahead wholesale auction. Generators bid in what’s supplied and at what price, and the market matches supply to demand for every hour of the next day. But the price everyone pays, and every generator earns, isn’t an average of those bids. It’s set at the margin, the price of the single most expensive generator still needed to meet demand that hour. This is easiest to see visually.
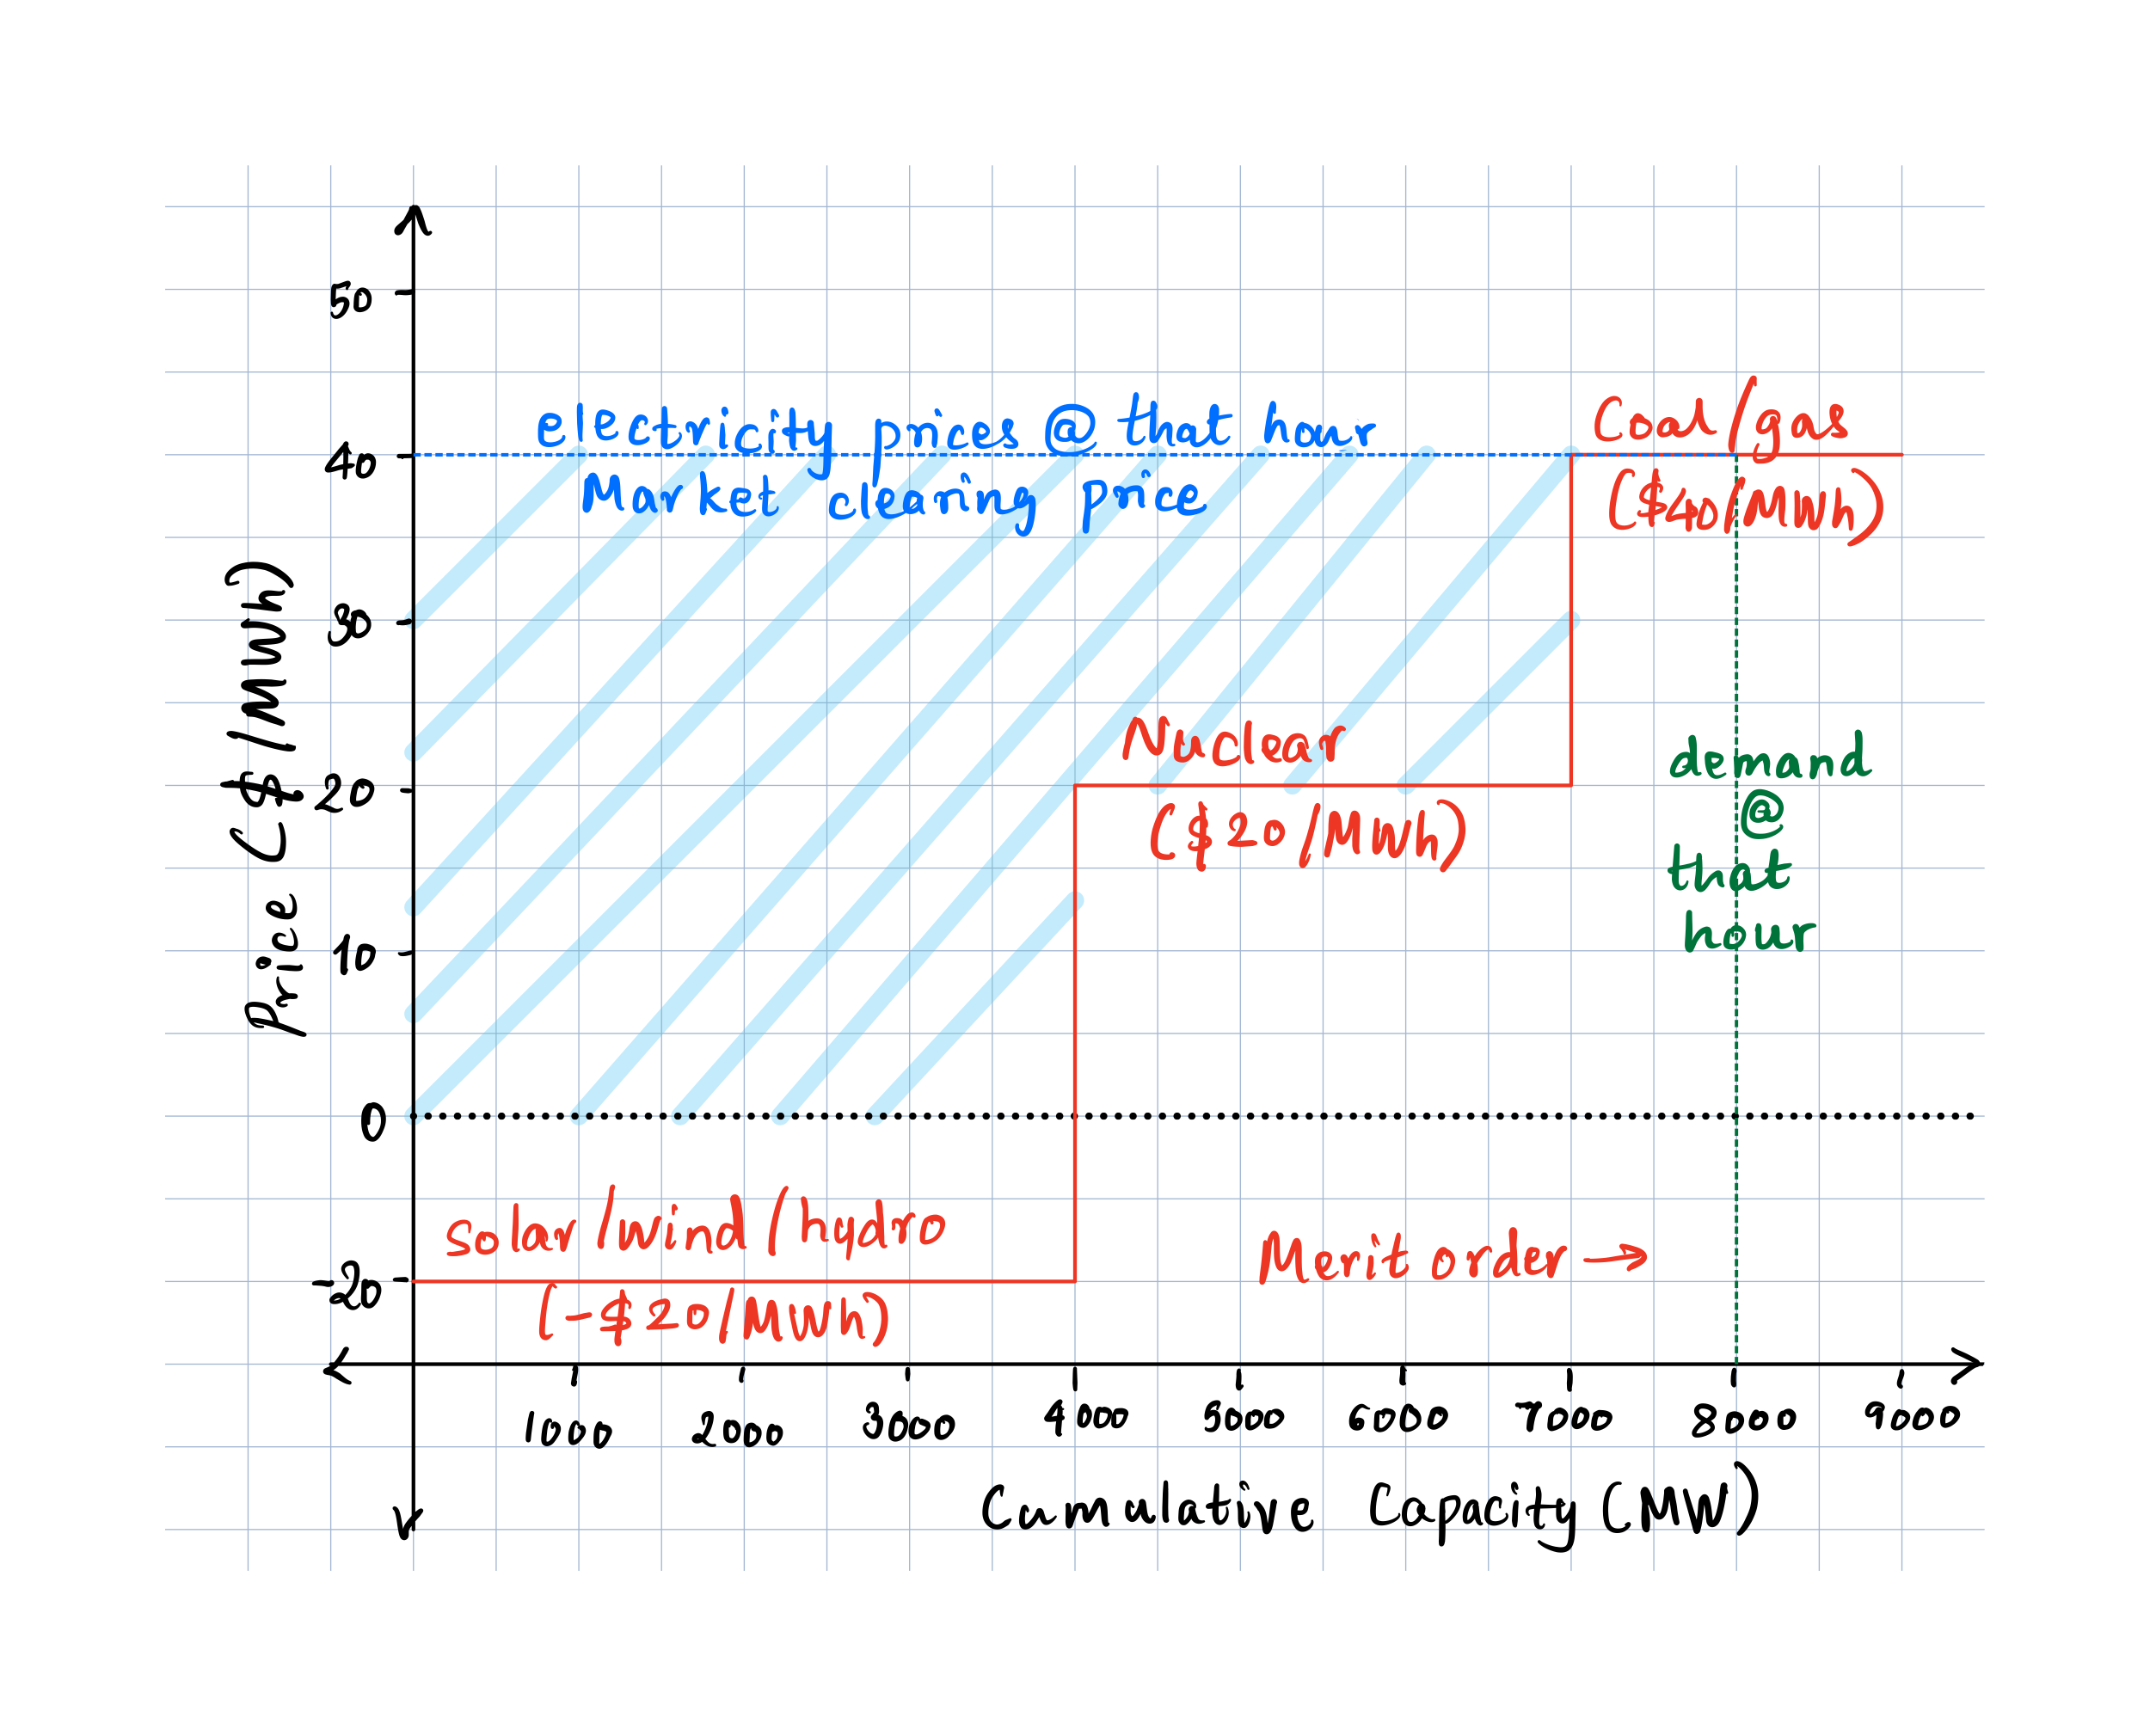
This chart shows the merit order, generators ranked from cheapest to most expensive.
One quick clarification: what’s bid here is marginal cost, the cost of producing one more unit that specific hour, not average cost across a whole year. It includes fuel where relevant, plus maintenance, staffing, wear and tear, and safety checks, everything it takes to run that plant a little bit more, right now.
Solar, wind, and hydro sit at the bottom, bidding at or below $0/MWh, here at -$20/MWh. Once built, there’s no fuel to buy, so they’ll bid low just to guarantee dispatch. Many also receive subsidies paid per unit generated, so they can still profit even bidding negative. Nuclear comes next at $20/MWh, low but real running costs, and it also tends to bid low rather than shut down, since restarting a reactor is slow and expensive. Coal and gas sit at the top, $40/MWh here, burning fuel on top of maintenance and staffing costs. Oil sits higher still, which is why it doesn’t appear on this chart.
The dashed line in green marks demand for that hour - 8,000 MW. The market fills the stack cheapest first: all of solar, wind, and hydro (4,000 MW), then all of nuclear (up to 7,000 MW), then just enough coal or gas to cover the last 1,000 MW. That last, most expensive generator needed sets the price for the whole hour in blue: $40/MWh.
Here’s the surprising part: every generator dispatched that hour gets paid that same $40/MWh, including the solar, wind, and hydro that bid -$20/MWh. This is the uniform clearing price, everyone earns the same rate regardless of what they bid.
Now imagine wind, solar, and hydro alone could cover the full 8,000 MW on a particularly windy, sunny day. Nuclear and coal wouldn’t be needed, and the price-setting generator would itself be a renewable bidding near or below $0/MWh. That’s the entire mechanism behind negative prices: the marginal, price-setting generator simply changes depending on how much low-cost supply is available that hour.
Yes, More Renewables Really Can Mean Cheaper Energy, When the Weather Cooperates
The more wind and solar you add, the more they tend to all generate at the same time (when the weather is good across a region), and the more they collectively push the price down during exactly those hours, that is called as price cannibalization.
For an individual project, this means that generating a lot of energy on a good weather day isn’t automatically a financial win. If every other wind and solar asset in the region is also generating heavily at that same moment, the price that hour might be near zero, or negative.
Storage Helps, But It Doesn’t Answer the Real Question
The most talked-about solution to this mismatch is energy storage, mainly batteries. The logic is straightforward: instead of curtailing a wind farm when there’s too much supply, store that extra energy in a battery and release it later, when demand (and price) picks back up.
Alongside storage, there’s a second lever worth mentioning: demand response, enabled by smart meters. Rather than storing the excess energy, this approach shifts when electricity gets used, for example, an EV charger or heat pump automatically running during a cheap or negative-price hour instead of the evening peak, effectively soaking up the surplus in real time rather than saving it for later. Smart meters are what make this possible at a household level, since they can track usage hour by hour rather than as one lump total, giving both households and grid operators the visibility to act on price signals as they happen.
Storage and demand response both help solve the problem at a system level: less energy wasted overall, fewer hours of deep negative pricing, a grid that can absorb more renewables without curtailing them. But neither one answers the question a developer actually needs answered before committing capital to a site:
Will this specific project, in this specific location, actually be profitable?
What This Means for How We Assess Sites
The standard job of a wind resource analyst (me) is to answer one question: how much energy will this site produce? We build yield estimates, P50s, P90s, using historical wind data, terrain, and turbine specs. It’s genuinely useful, but it was built for a world where more energy produced reliably meant more revenue earned. Curtailment and negative pricing are quietly breaking that assumption.
Two sites can have near-identical wind resource on paper and still be worth very different amounts, because what matters now is capture price, not just output. Here’s the catch: build somewhere with strong wind or solar resource, and other developers have likely spotted the same good weather and built nearby too. The grid around your project ends up saturated with wind and solar generating at the same time as you, exactly when prices tend to fall.
The trouble is capture price isn’t a fixed number you can look up. It’s local, tied to the specific grid node a project sits in, and dynamic, shifting every time a new plant comes online nearby. A generic regional price curve can’t capture that.
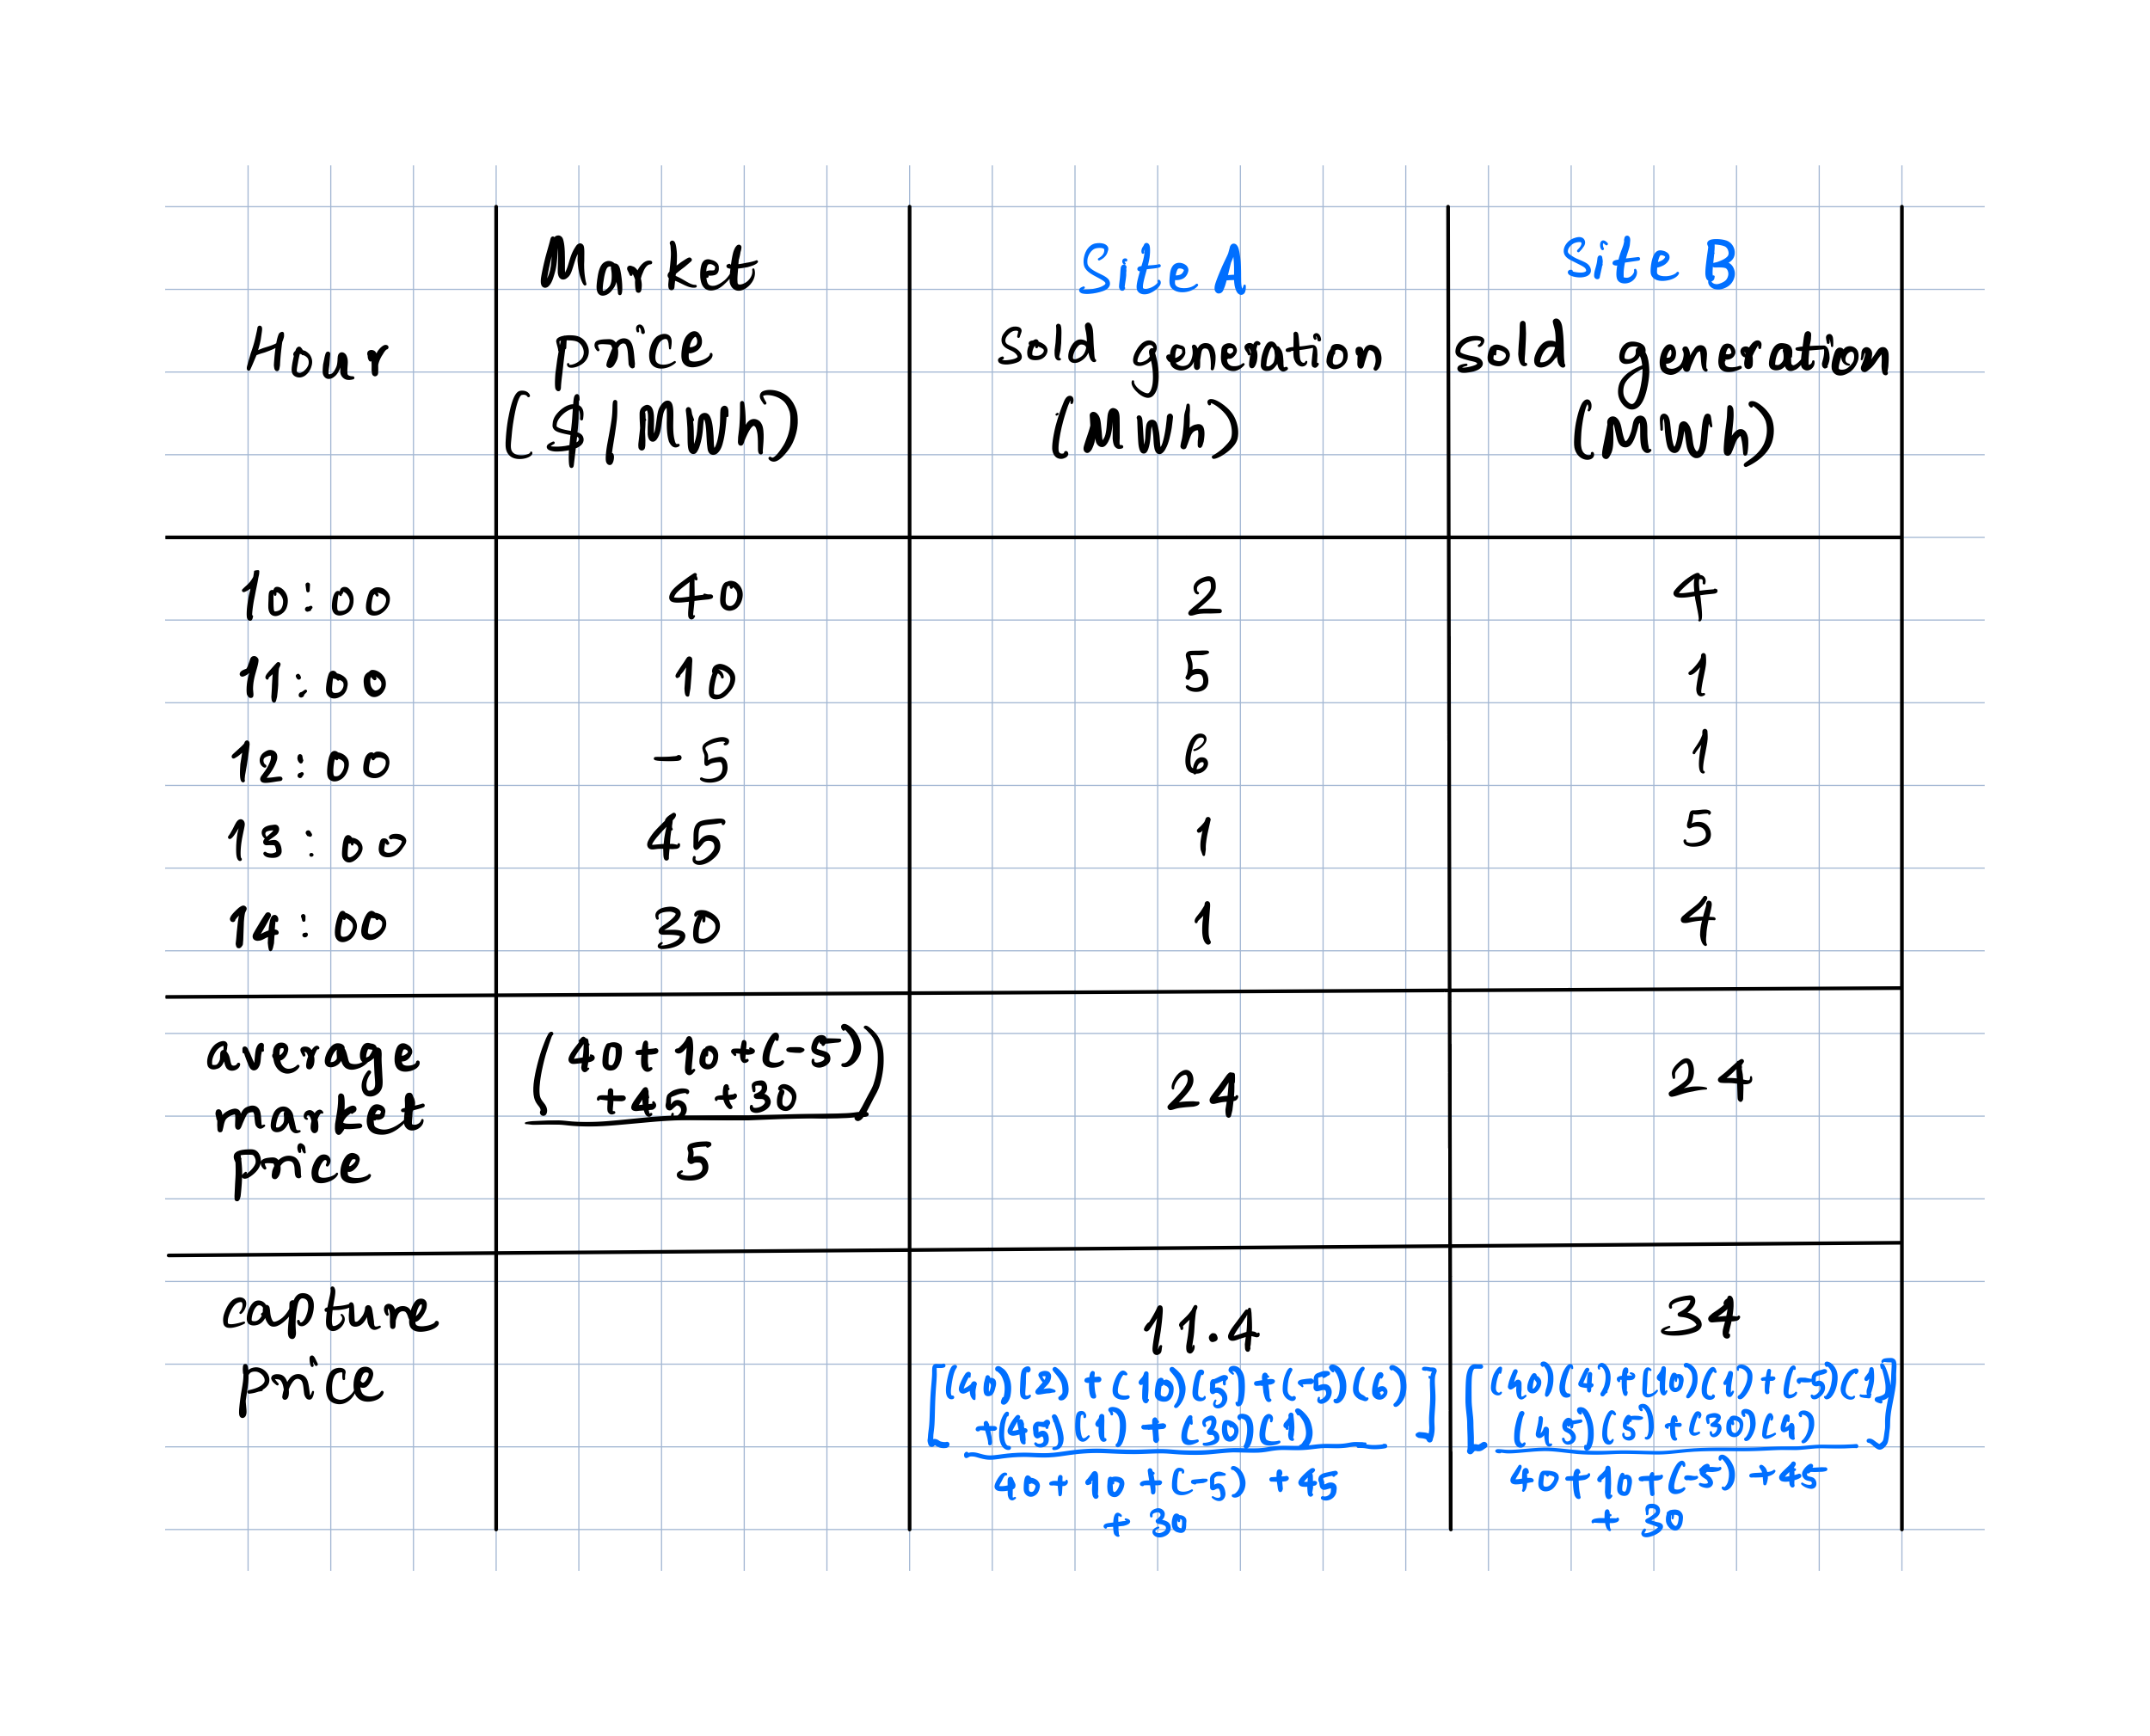
Same market, same average price, same total generation, but Site A earns roughly $11.7/MWh while Site B earns roughly $34/MWh. Site A generated heavily at 11:00 and 12:00, exactly when the market was oversupplied and prices were low or negative. Site B generated more at 10:00, 13:00, and 14:00, when prices were higher. Two sites in the same broader market can still see quite different local wind timing, so identical zone-level pricing doesn’t mean identical value.
In plain terms, capture price is the average electricity price a generator actually earns, weighted by the hours when it produces. It depends heavily on when a project generates relative to everyone else, not just how much it generates in total.
A few region-specific models already attempt this, forecasting prices alongside renewable output, mostly built for large utility-scale players in a handful of major markets. But a wind farm takes years to go from assessment to operation, so what matters is what the price signal looks like once the project is actually running, not today. Over that timeframe, you’re also guessing at fossil fuel policy shifts and what else might get built nearby before commissioning, since every new plant reshapes the local merit order again. That’s a harder problem than forecasting next week’s prices, and it’s where I think there’s real room to build something better suited to how long these projects actually take.
Where This Leaves Us
Curtailment and negative pricing aren’t a sign that renewables have failed. If anything, they’re a sign of how fast renewables have succeeded, faster, in places, than the grid’s flexibility has managed to catch up. Storage and demand-side tools like smart meters will keep chipping away at the mismatch from the system side. But from where I sit, the more interesting shift is happening at the project level: the industry is slowly moving from asking “how much energy will this site generate” to “how much will that energy actually be worth, in this specific place, at this specific time.” That’s not a fully solved problem yet, but it’s very much the direction wind resource assessment is heading, and it’s one I’d like to keep digging into.
Q&A
Q: What is curtailment in the context of wind and solar power? A: Curtailment is when a wind or solar project’s output is deliberately reduced or stopped, usually because there’s more electricity being generated than the grid needs or can absorb at that moment, making it uneconomical or technically unsafe to keep exporting power.
Q: Why do electricity prices sometimes go negative? A: Prices go negative when there’s more low-cost electricity available than demand at that hour, and generators would rather pay a small fee to keep running (for technical or subsidy-related reasons) than shut down entirely, or when they are financially incentivized to keep bidding to stay dispatched.
Q: What is capture price, and how is it different from the average wholesale price? A: Capture price is the actual average price a specific wind or solar project earns for the electricity it sells, based on when it generates. It can be meaningfully lower than the average wholesale price if a project tends to generate heavily during hours when the market is already oversupplied.
Q: Does more renewable energy always mean cheaper electricity? A: Only during the hours when renewable output is high. Wind and solar have near-zero marginal costs, so when they generate a lot at once, they can push prices down sharply for those specific hours, an effect known as price cannibalization.
Q: Can battery storage solve curtailment on its own? A: Storage helps significantly by absorbing surplus energy for later use, but it’s generally viewed as one part of the solution alongside demand-side flexibility (like smart meters and demand response), rather than a complete fix on its own.
Did this piece add something to your thinking? You can buy me a coffee with no subscription required, just a small way to support independent writing on energy.
Disclaimer: The views expressed in this post are my own and do not represent the views, positions, or opinions of my employer. This post is written for general informational purposes and does not constitute investment, engineering, or financial advice.